
Biological infrastructure
for palm oil mills, deployed.
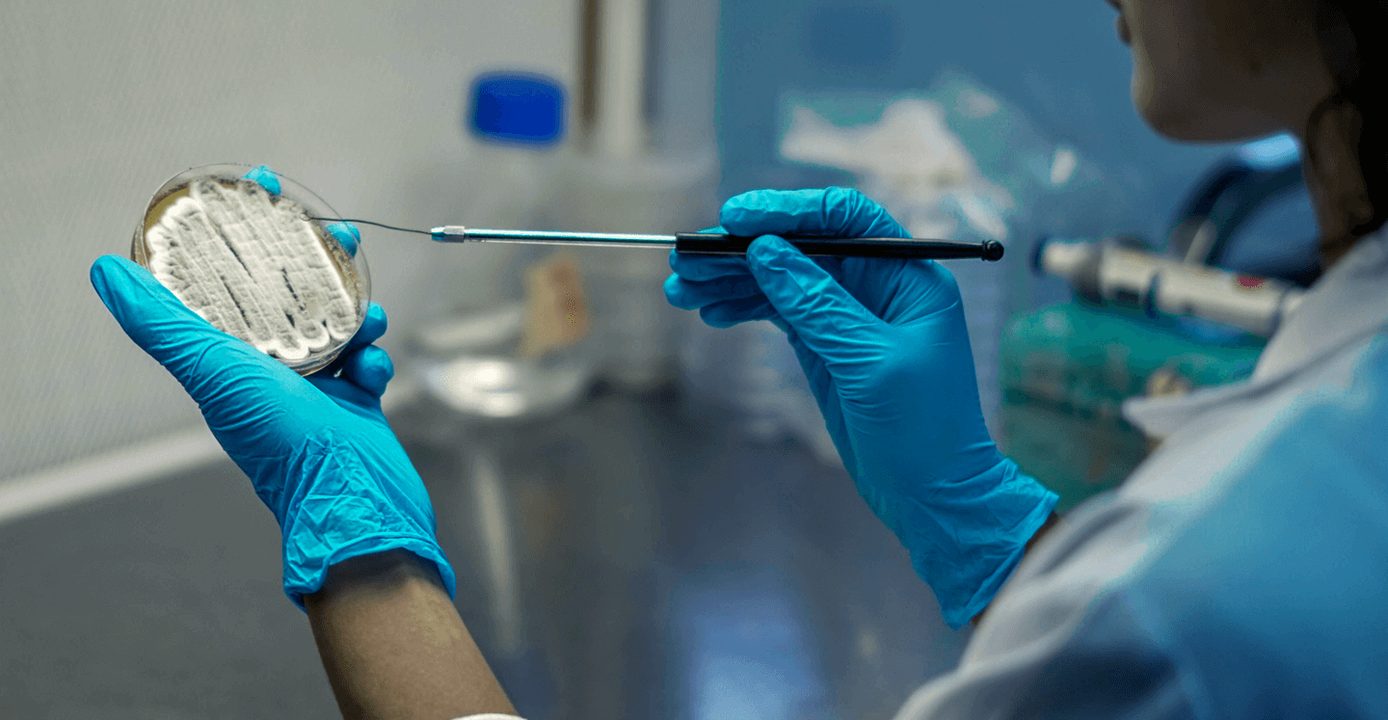
We deploy BPPA's biological substrate engineering platform at palm oil mills across Malaysia and Indonesia. Across 24 completed sites, the group has processed more than 9 million tonnes of palm oil mill biomass into Matrix.
Discover the platform33% of the world’s soils are already degraded. Over 90% at risk by 2050.
FAO · ITPS · Status of the World’s Soil Resources · 2015
“The soil microbiome is a game changer for food and agriculture.”
FAO · 2022
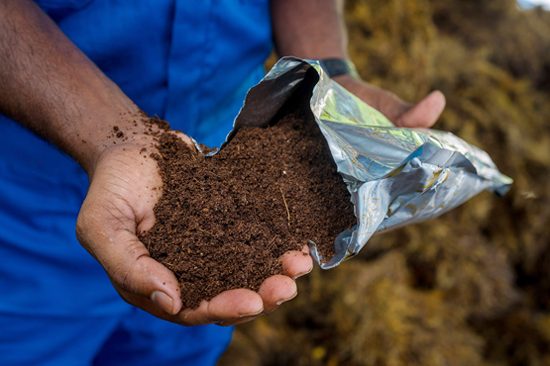
Matrix carries a live microbial community back to the plantation soil that grew the crop, at the scale a mill actually produces waste. It works alongside the existing agronomy, restoring what long-cycle intensive production draws out. Restoration as the default nutrient economics. Not depletion.
Palm oil milling produces two primary waste streams that quietly leak methane and money. Our system converts both into Matrix: biological fertility, returned to the soil it came from.
We finance the build, sit our refinery beside the mill on a fixed footprint, and operate it under a long-term service agreement. The mill's existing process line is untouched.
Eighteen years and twenty-four sites later, we have the operating record to deliver carbon liability removed and CAPEX absorbed at scale, across Malaysia and Indonesia.
Methodology aligned with Verra. Standards set with RSPO. Science verified with FAO and university research groups across three continents. Decarbonisation at this scale runs through institutions.
Five components.
One operating system.
Waste to fertility.
Our system. Your output.
BPPA owns the science and the technology stack. BARformula deploys it on the mill footprint, runs it continuously, and reports against contracted tonnage.
The Advanced Microbial Refinery is a closed-loop biomass conversion facility.
On your land. On our balance sheet.
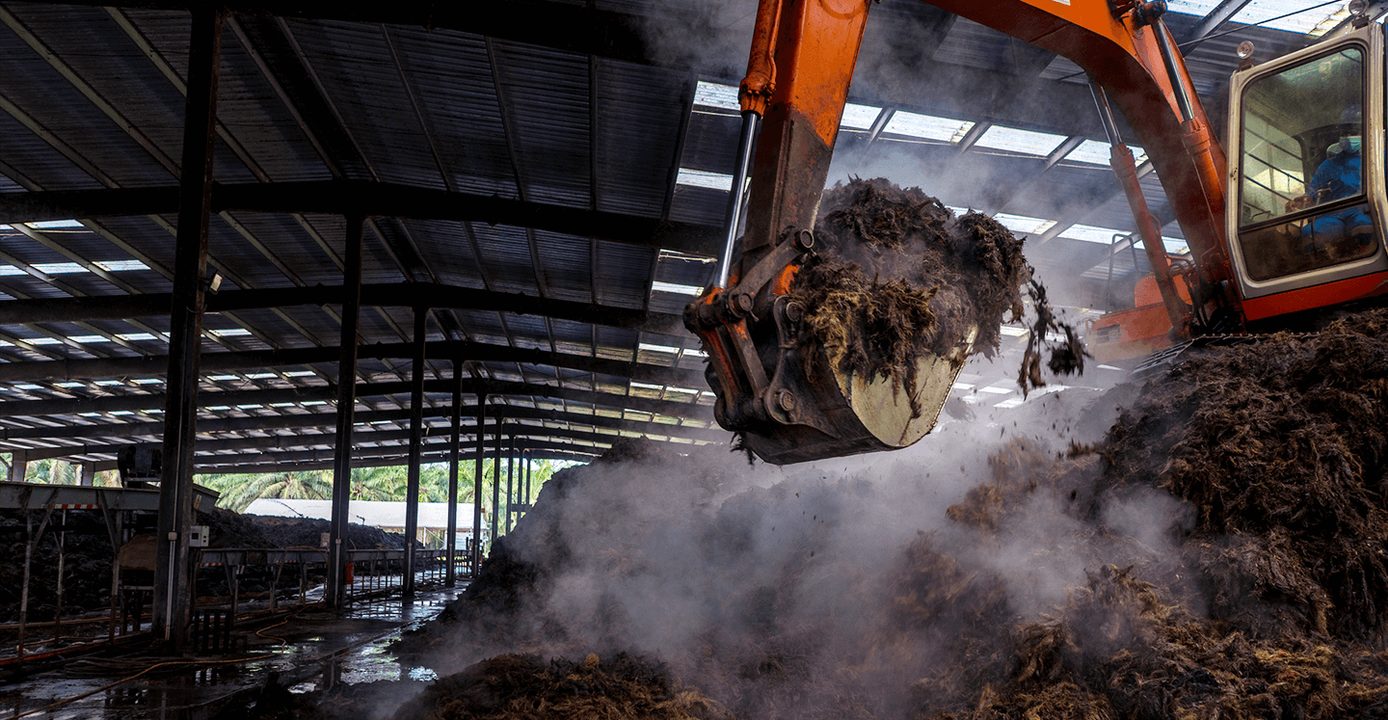
From two primary waste streams to one substrate.
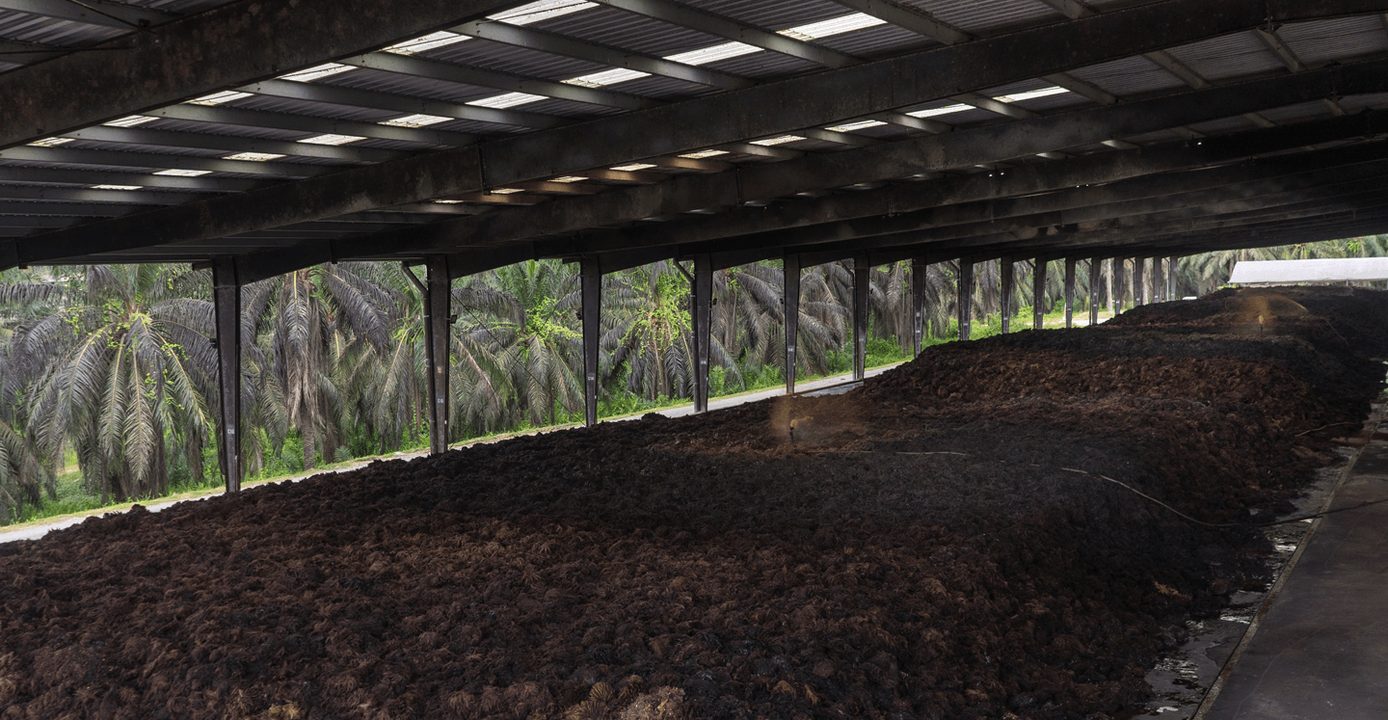
The AMR ingests the two material streams every palm oil mill already produces: empty fruit bunches (EFB) and palm oil mill effluent (POME). Under engineered microbial conditions and aerobic management, these convert into Matrix over a fixed 45-day cycle.
The mill's existing process line is untouched. The AMR sits beside the mill on a standard 180m × 60m footprint. BARformula finances and constructs. BARformula owns and operates for the contract term.
Four tiers of Matrix. Calibrated to the site, not the catalogue.
~21% of FFB, returned to your soil.
Matrix is the engineered biofertiliser that returns to the plantation as the AMR's productive output. Each tier is a different microbial enrichment, selected based on the soil profile and agronomic objectives at the site. Tier selection happens at site scoping, not at the order desk.
Baseline EFB substrate with the foundational microbial consortium. Used at sites where the primary objective is biomass closure and methane avoidance.
- Lignocellulose breakdown
- Aerobic-stable consortium
- Pathogen suppression
- Standard NPK profile
Core plus site-tuned microbial enrichment. Selected when the soil profile has specific deficiencies in P, K, or trace nutrient mobilization capacity.
- P-solubilising bacteria
- K-mobilising consortium
- Micronutrient release
- Site-calibrated dosing
Plus tier plus pathogen-suppressive functions. The default for sites with active Ganoderma pressure or replant cycles requiring biocontrol.
- Trichoderma-led Ganoderma antagonist
- Bacillus-led bio-control for palm health
- Biofilm formation traits
Full-spectrum substrate carrying the complete BARcode Palm Oil consortium. Specified for replant programs, distressed estates, and Project Atlas-class transformations.
- Full BARcode Palm Oil consortium
- Volcanic mineral co-formulation
- Endophytic mycorrhiza (AMF) root colonisation
- Site-specific encoder profile
What changes when biology runs the conversion.
Yield up. Cost down. Soil restored.
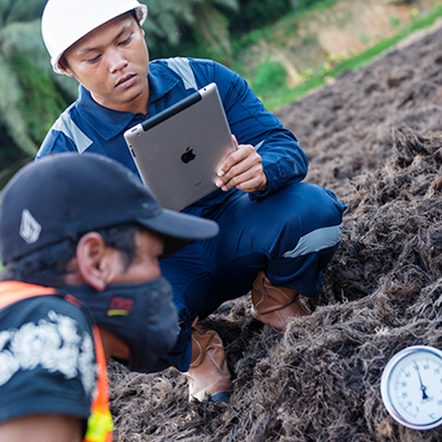
Three measurable outcomes, all field-validated across BARformula sites and corroborated in the published literature. The numbers below are not projections.
Open anaerobic POME ponds vent the most methane. AMR's aerobic process avoids the anaerobic pathway entirely. Methane is roughly 28× more potent than CO₂ over a 100-year horizon.
Matrix applied at 10 MT/Ha with average nutrient profile (0.7%N, 0.1%P, 1.1%K). Yield gains compound over multiple cycles as soil microbiome rebuilds. Source: Journal of Oil Palm Research, Vol 25(1), April 2013.
Documented across multiple operating sites. Translates directly to mill operating cost reduction in the order of RM1M per annum on a typical mid-sized site.
Palm oil topsoil typically presents at C:N 10–14:1, well below the 25–30:1 at which microbial nutrient cycling functions optimally. Matrix application restores the ratio over multi-year cycles.
Three numbers every plantation operations head should keep on the wall.
What boards need to know.
The case for biological infrastructure is not abstract. It sits in three measurable threats facing the industry today, each of which BARformula is engineered to address.
Three generations of planters have inherited the same playbook. The next cycle has to be different.
Carbon liability, off your books.
Pond the effluent. Stockpile the bunches. Apply synthetic fertiliser to the soil. Repeat at the next mill, then the next. The playbook has worked for fifty years and the people who learned it are now teaching it to the people who will run the next thirty.
An uncontrolled-baseline mill processing 200,000 t FFB/year vents ~7,400 tonnes methane annually from open anaerobic POME ponds (industry reference: 56.2 kg CH₄/tonne POME, MPOB uncontrolled-lagoon factor derived using IPCC methodology). At GWP-100 = 28 (IPCC AR5, the value voluntary carbon markets default to), that runs to ~207,000 tCO₂e per mill per year. Across roughly 1,500 operating mills in MY+ID, even with current biogas-capture coverage the unmitigated industry footprint sits in the order of 150–250 million tCO₂e per year. Site-specific credited avoidance depends on the existing baseline at each mill.
The soil under the trees runs the other way. UN FAO measures 33% of global arable topsoil lost in the last 40 years. Plantation soils run the leanest of all, at C:N ratios of 10–14:1 — roughly half the 25–30:1 ratio at which living microbial soils sustain themselves. Synthetic dependency rises every cycle.
BARformula has built twenty-four sites since 2008, converting 9.3 million tonnes of mill biomass into Matrix. The math at one mill scales to the math at the industry. The contract structure does not require the mill to carry the CAPEX. The next cycle does not have to look like the last.
The choice every mill faces. Stated plainly.
Two paths. One bill.
Twenty-four sites. Twelve plantation groups. Built.
Built for your peers, by name.
From the first 2009 site at PT Alamraya Kencana Mas through the most recent deployments at Sawit Kinabalu (Sabah) and Korindo (Indonesia, West Papua) in Q1 2026. Every contract written and built by BARformula.
“Every palm oil mill sits on millions in unrealised revenue.”
Francis PereiraFmr. Vice President · Cargill
Four ways to start. Pick the one that fits your decision stage.
No commitment until you ask.
MSFA pre-scoping calculator OPEN →
Eight inputs about your mill. We model Matrix purchase, fertiliser line displacement, methane avoidance, and net annual operating position. PDF report sent to your work email in two minutes.
Site visit at an operating AMR
Two hours on the ground at a current production site. Direct conversation with the plant manager and the plantation operations head. We arrange the logistics.
Feasibility scoping
Send mill capacity, location, current waste-handling spend, and fertiliser line. We return a sized AMR specification, indicative MSFA outline, and a go/no-go.
Direct to leadership
For groups considering an MSFA across multiple mills. Direct conversation with senior BARformula leadership about the deployment programme.
Frequently asked.
What boards ask first.